Performance
Every timing in Hallmark comes from a named run, on a named machine, with a stated timer boundary. This page collects the measurements, shows how the timers nest, and says what was never measured. The raw records, logs and proofs behind each number are in reference runs.
Read a number in three questions
- Which run? Each run has its own machine and date. Numbers from different runs never add up to an end-to-end latency.
- What does the timer enclose? A "proving" time can mean the final STWO call, a SASH proving session or a whole process; these differ by a factor of two or three.
- Is it nested? Several rows sit inside others. Add only rows that are siblings.
| Run | Workload | Machine | Date | It is | It is not |
|---|---|---|---|---|---|
| L1 | TinyLlama answer, 23 segments, CPU then GPU | HF Jobs, one NVIDIA H200, 23 vCPUs, 4 Rayon threads | 2026-10-26 | One matched SIMD/CUDA pair with shared inputs | A latency distribution, or a fresh preparation |
| C1 | Classifier workflow: train, build, nine proofs | Apple M4 Max, 16 CPUs, 48 GiB, 4 prover threads | 2026-10-28 | One fresh instrumented run | A latency distribution |
| J1 | L1 proofs re-verified + three new classifier proofs | Same Mac | 2026-10-28 | Host composition of retained LLM proofs | Fresh GPU proving |
| A100 | The nine C1 classifier proofs, CPU and CUDA | HF Jobs, one A100-SXM4-80GB, 12-vCPU quota | 2026-10-28 | Three matched pairs | A full workflow; training and witnesses are reused |
The headline numbers
| Number | Run | What the timer encloses | Do not confuse with |
|---|---|---|---|
| 53.94 s | L1 | SASH proving sessions on CUDA, summed over 23 segments: commitments, interaction, FRI | 155.89 s of complete GPU segment commands |
| 547.75 s | L1 | The same sessions on CPU SIMD | 679.49 s of complete CPU commands |
| 3.40–3.53 s | L1 postflight | One full-bundle check by the native Mac verifier, after compilation, roots compiled in | 77.4 s on Linux, which derives the roots at runtime |
| 24.06 s | C1 | Nine final STWO proving calls | 50.03 s of complete prover commands |
| 0.807 s | C1 | Nine fresh proof-only verifier processes | The caller's native rerun, not timed separately |
| 302.96 s | C1 | The whole classifier controller, training included | uv bootstrap, outside the timer |
| 92.41 → 22.22 s | A100 | Nine complete prover commands, CPU → CUDA, median of three pairs | The C1 Mac timings |
TinyLlama on one H200 (L1)

CUDA accelerates constraint evaluation, commitments and FRI. It does not touch trace generation, which builds the witness on the host before the session starts; that is why the first row barely moves. Constraint evaluation recorded zero CPU fallback calls. Interaction generation also stays on the CPU, inside the session.
What a segment command contains
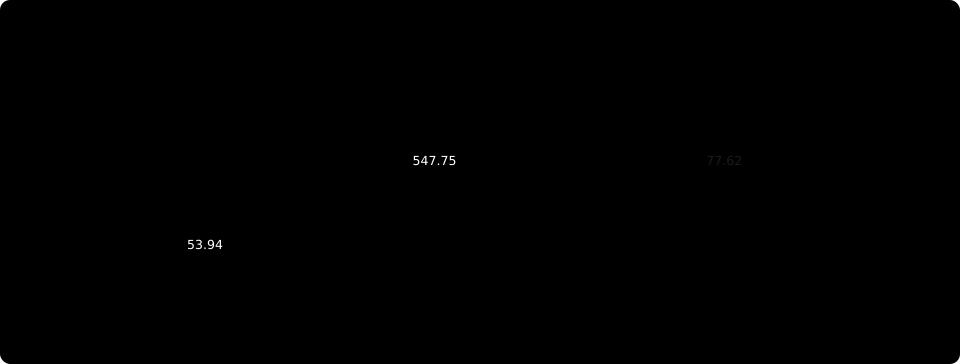
Each segment command reports three timed stages; the rest is a remainder. Summed over all 23 segments:
| Stage, summed over 23 segments | CPU / SIMD | GPU / CUDA |
|---|---|---|
| Trace generation | 31.84 s | 32.14 s |
| Proving session | 547.75 s | 53.94 s |
| ↳ of which interaction work | 60.72 s | 36.95 s |
| Inline verification | 77.62 s | 34.40 s |
| Remainder, by subtraction | 22.28 s | 35.41 s |
| Complete segment commands | 679.49 s | 155.89 s |
The remainder is the complete command minus the three timed stages: loading, serialization and anything else not separately timed. It is computed, not measured. Lower-level FRI, Merkle and constraint timers are kept in each segment's record; they overlap and do not add up to wall time.
Per segment

The summed 10.15× hides a lot of spread. The first three SIMD segments take 278.78 s, about half the CPU total; the record does not isolate why. Leaving them out gives 6.39×. That is a sensitivity check on one pair, not a replacement headline.
Verifying the LLM bundle
| Verifier | Time per full-bundle check | Preprocessing |
|---|---|---|
| Native Mac verifier (L1 postflight) | 3.40 / 3.53 s | Caller's 23 shape roots compiled into the binary |
| Fresh Linux verifier, 8 vCPU / 32 GB | 77.40 / 77.61 s | Shape trees derived at runtime |
| Full-grid CPU verifier on the H200 host | 85.35 / 84.32 s | Runtime, run once on each backend's proofs |
All three run the same SASH cryptographic checks. The Mac verifier skips rebuilding the shape trees because the caller enrolled them in advance, which is a trust decision, not a faster algorithm. None of them runs on a GPU.
The fresh CPU workflow
make e2e-llm was reproduced end to end on 2026-10-23, on CPU only:

| Stage | Recorded |
|---|---|
| Native preparation, excluding downloads and packing | 32.22 s |
| Build job, including six upstream tests | 560.40 s |
| Proving job, including root derivation and serialization | 533.64 s |
| Summed proving time inside that job, 23 segments | 328.46 s |
| Fresh proof-only verification, two processes | 80.11 / 78.45 s |
| Whole command | 31 min 15 s |
| Compute cost bound, not an invoice | $0.31 |
Proving ran on a 32-vCPU / 256-GB CPU worker, a different machine from L1, so its 328.46 s does not compare with L1's 547.75 s. Evidence.
Classifiers on an M4 Max (C1)
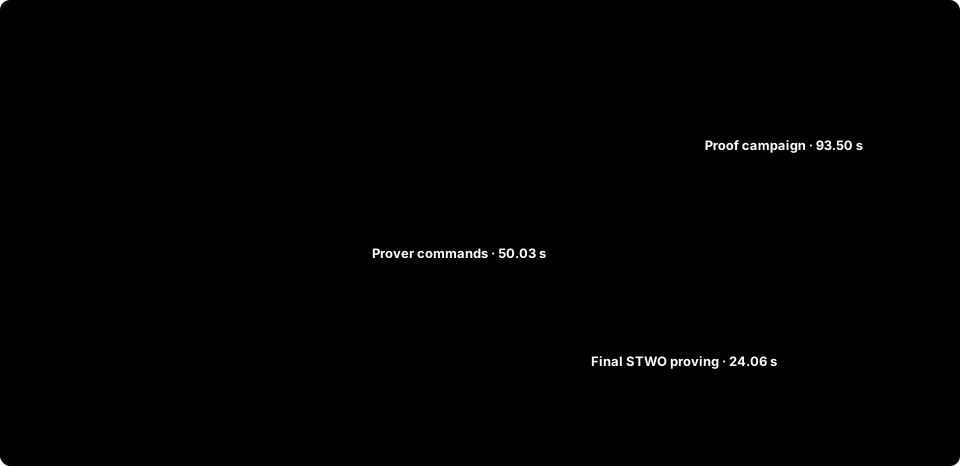
Read the figure top down. Training the CNN is most of the run. The proof campaign wraps enrollment, witness construction, proving, verification, rejection checks and host work. Inside the nine prover commands, the final STWO call is under half; preprocessing is redone for every proof, because the CLI is stateless.
| Inside nine prover commands | Seconds |
|---|---|
| Input parsing | 2.216 |
| Preprocessing and model commitment | 7.882 |
| Admission, twiddles and transcript | 0.172 |
| Base trace generation and commitment | 0.035 + 6.109 |
| Interaction generation and commitment | 0.392 + 7.782 |
| Final STWO proving | 24.061 |
| Serialization | 0.033 |
| Unattributed, by subtraction | 1.346 |
| Complete prover commands | 50.028 |
The CNN proofs cost more than twice the rule and MLP proofs: 8.4–9.8 s per prover command against about 3.9 s. Proof files are 1.93–2.15 MB each. Each proof's time and size.
Classifiers on an A100

The same nine circuits, inputs and enrollment as C1, proved three times on CPU and three times on CUDA on one host. Proof bytes match C1 exactly. The suite ratio (4.16×) is lower than the final-call ratio (5.87×) because the commands also contain host work, such as base and interaction trace generation. Full report.
Composition (J1)
| Stage | Seconds |
|---|---|
| Native LLM workflow: build, two honest checks, 36 mutations | 216.87 |
| ↳ of which verifier build | 115.53 |
| Classifier controller: three new proofs and binding checks | 44.12 |
| ↳ three complete prover commands | 18.854 |
| Outer-join proof checks | 0.167 |
| Whole composed command | 266.29 |
FlashProve beside SASH
FlashProve, the second LLM prover, proves a different statement about a
different model, so its timings are not another row of L1. Its H200 run proved
48 tokens of a synthetic MoE in a 22.28 s example, which also commits and
verifies; the proof is 4,145,980 bytes. On the M4 Max, cp_verify takes 0.63 s
on it and 7.88 s on upstream's stored 1,000-token Maverick-shaped proof.
SASH and FlashProve compared has the full table and its
limits.
Sizes and memory
| Artifact | Size |
|---|---|
| LLM proof, one layer segment | 28.96–33.82 MB |
| LLM proof, output head | 84.61 MB |
| LLM proof bundle, 23 files | 737,858,641 bytes |
| Classifier proof, one Circle JSON file | 1.93–2.15 MB |
| Classifier proofs, nine files | 18,063,779 bytes |
| Peak sampled memory | Value |
|---|---|
| L1 host RSS, CPU / GPU run | 103.75 / 8.07 GB |
| L1 GPU device memory | 67.67 GiB |
| C1 worker-tree RSS | 23.45 GB |
| A100 prover RSS, CPU / CUDA | 19.46 / 0.62 GB, plus 18.25 GiB on device |
Proof sizes exclude enrollment, keys and statements. RSS values are sampled high-water marks, not hard limits.
Not measured
- Fresh LLM preparation in L1. The checkpoint download, quantization and witness extraction were reused; the 2026-10-23 workflow times them on CPU.
- Isolated serialization and transfers. They are charged to their enclosing commands, never assumed to be free.
- GPU verification. Every verifier above runs on a CPU.
- Latency distributions. L1 and C1 are single observations. The A100 study has three pairs.
- A saving over native rerun. The classifier caller reruns native inference to rebuild expected verdicts; no timing shows verification beating a rerun.
Recompute everything
The figures on this page are generated from the evidence records:
python scripts/render_figures.py          # rewrite docs/assets/figures/
python scripts/render_figures.py --check  # fail if any figure is stale
To recompute the reference metrics from downloaded raw records, follow download and verify.